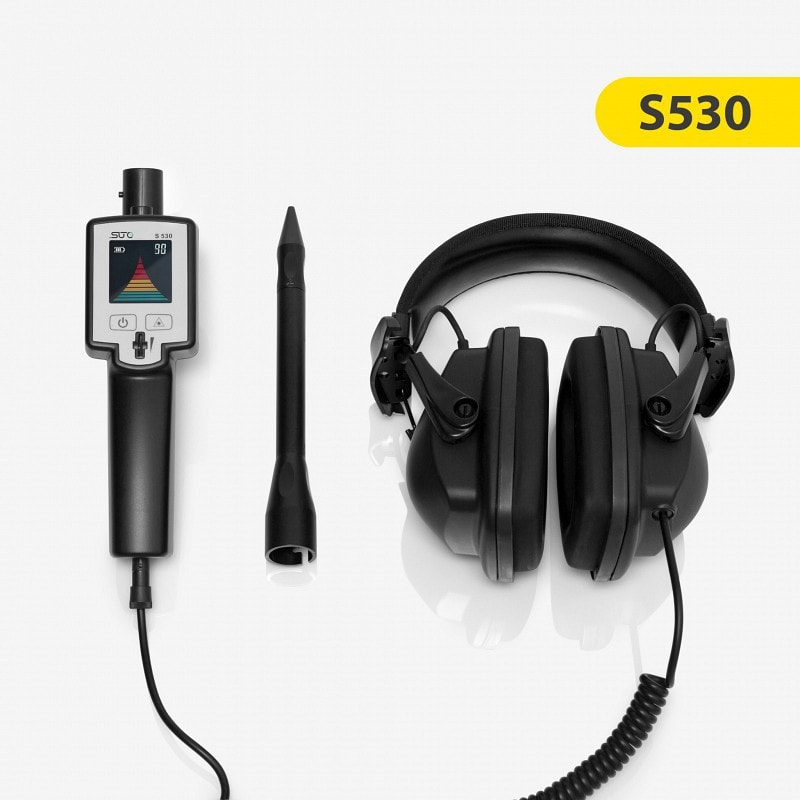
S532
S532 Acoustic Imaging Detector for Compressed Air and Partial Discharge Detection


Detect air leaks and discharges. Boost efficiency, cut costs, ensure safety.

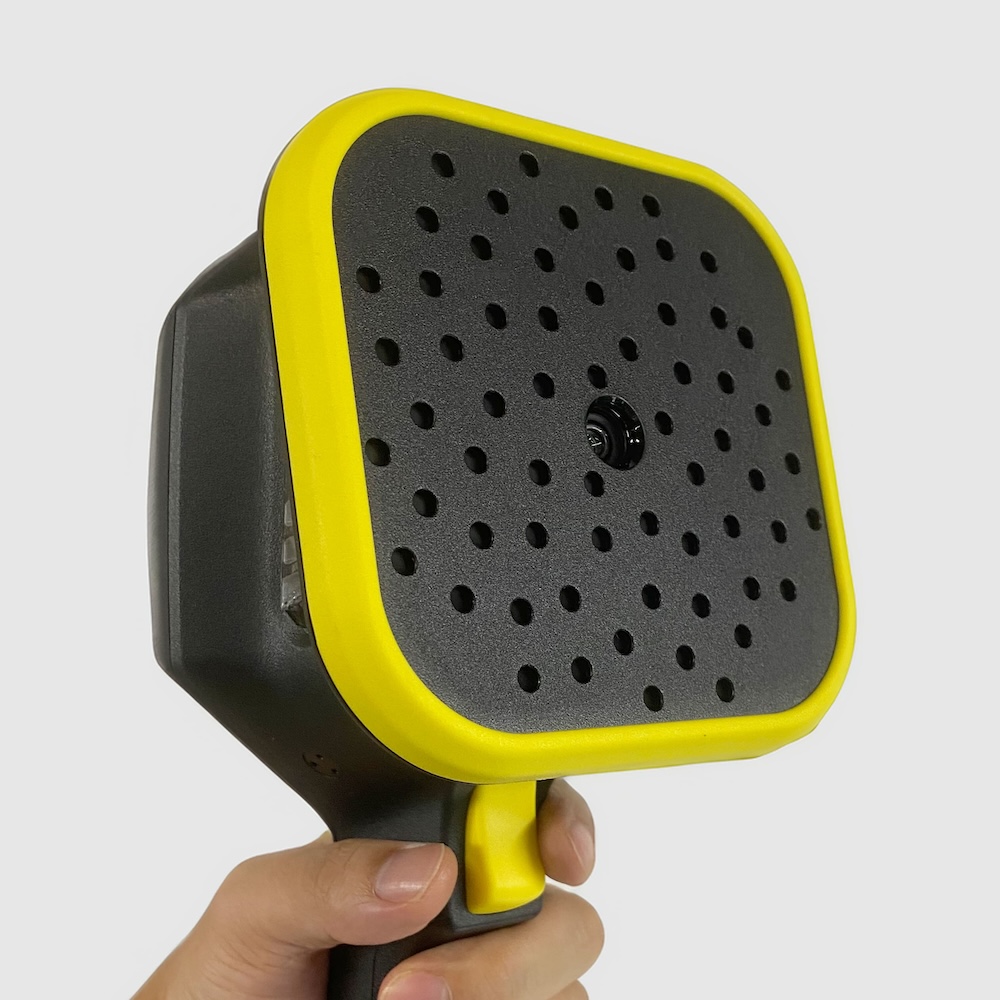
High sensitivity with 64 MEMS microphones
Detects leaks up to 150 meters away
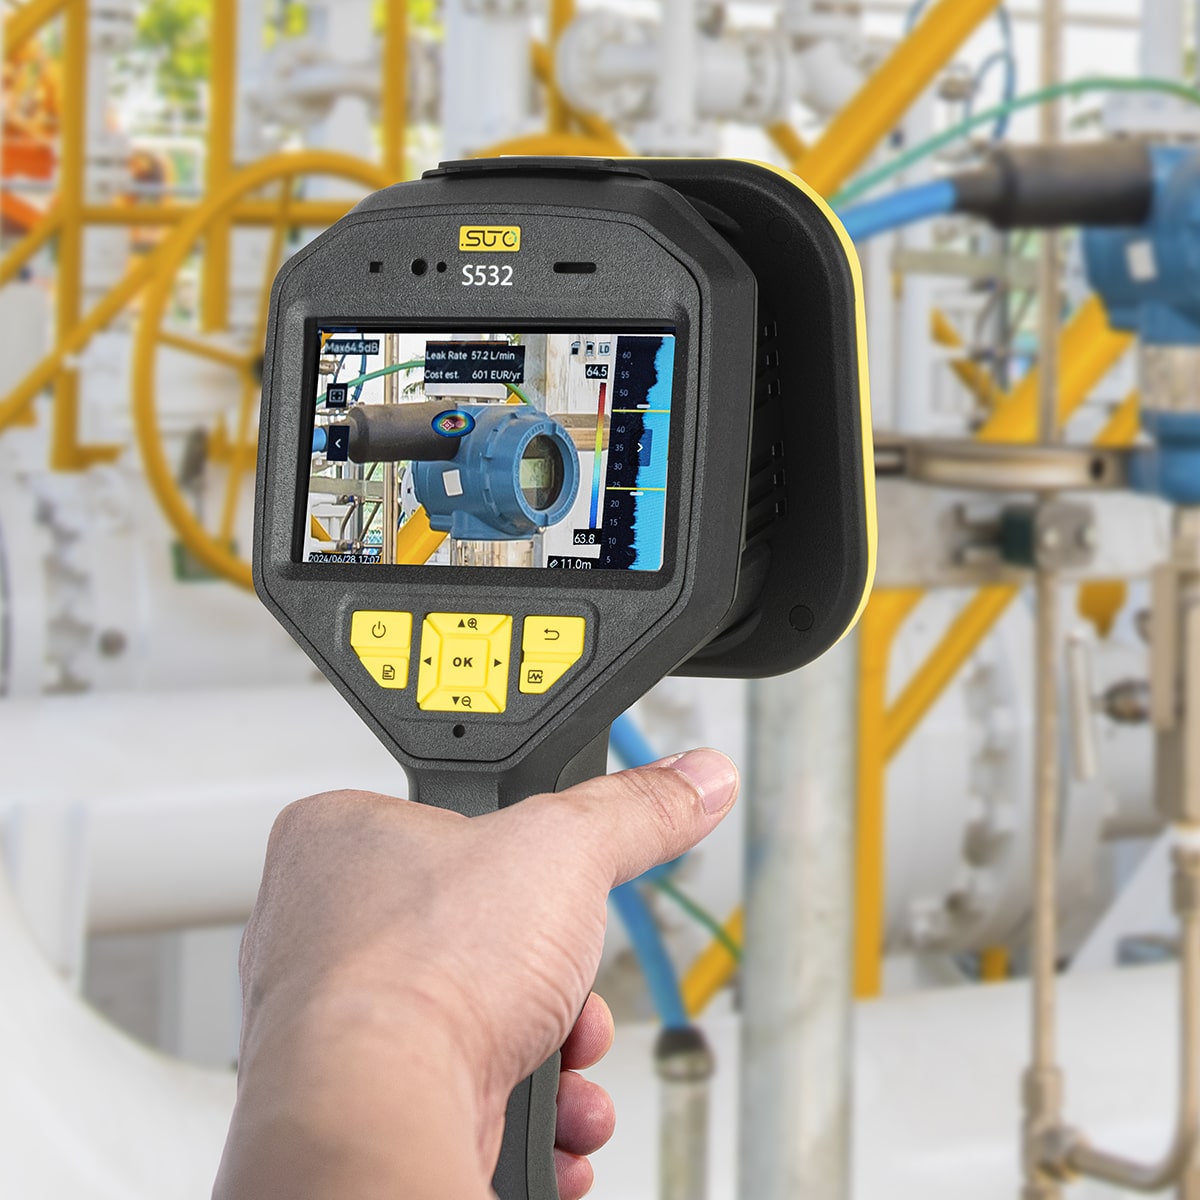
Real-time leak visualization with dynamic images
Adjustable frequency range (0-96 kHz)
Identifies partial discharges in high voltage systems
Built-in camera for leak photos
64 GB SD card for large storage
Voice recorder for adding memos
The S532 Acoustic Imaging Leak Detector is an advanced, professional tool designed specifically for industrial environments. It offers unparalleled sensitivity and accuracy in the detection and management of compressed air leaks and partial discharges.
Advanced Detection Capabilities
The S532 Leak Detector uses advanced acoustic imaging technology to visualize and record compressed air leaks and partial discharges, even at distances of up to 150 meters. This ensures that no leak goes undetected, regardless of its location.
Precision and User-Friendly Design
Equipped with 64 low-noise MEMS microphones, the S532 provides accurate detection over a wide frequency range from 0kHz to 96kHz. Its user-friendly design includes a 4.3″ LCD touch screen for easy operation and data visualization. Visual images overlaid with detection data facilitate fast and accurate problem identification.
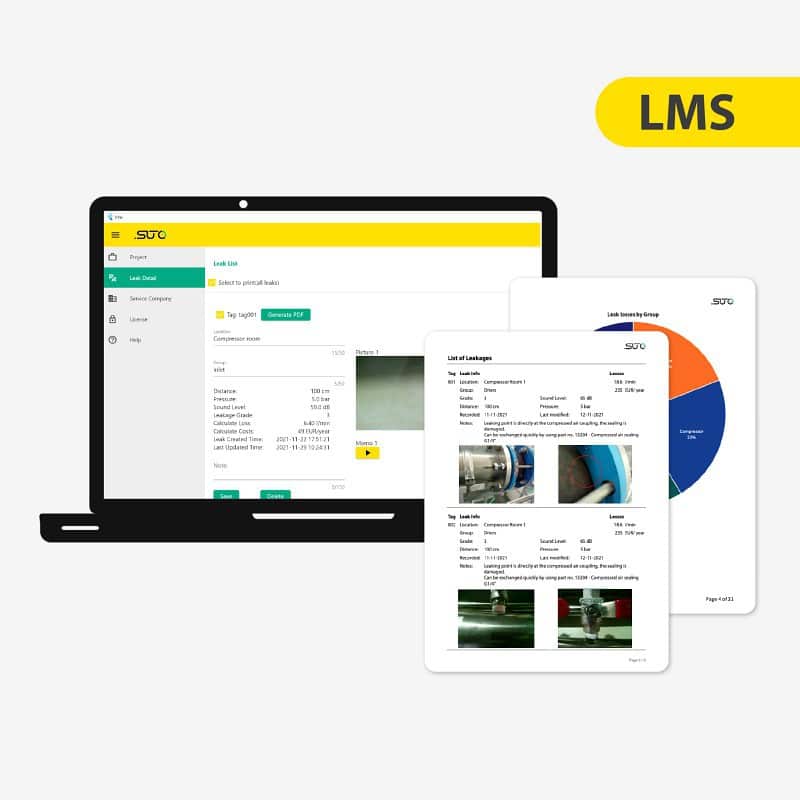
Seamless integration with LMS
The S532 integrates seamlessly with the SUTO Leak Management System (LMS) for comprehensive data analysis and reporting. This integration increases operational efficiency and reduces maintenance costs, making the S532 an indispensable tool in industrial environments.
- Compressed Air Systems: Detects and manages leaks to reduce energy wastage and operational costs.
- High Voltage Systems: Identifies partial discharges to prevent equipment failures and enhance safety.
- General Industrial Maintenance: Streamlines maintenance activities with precise detection and recording capabilities.
ACOUSTIC | |
| Microphones | 64 low-noise MEMS microphones |
| Bandwidth | 0 kHz to 96 kHz |
| Distance | 0.3m~150m |
| Acoustic Image Palette | White Black, Black White, Rainbow, Fusion, Ironbow, Red Black, Rain, Blue Red |
| Dynamic Range | Low Limit: <-15dB High Limit: >120dB |
| Leak Rate | >0.008 l/min @ 6 bar from 0.5 m >0.013 l/min @ 5 bar from 1 m |
| Discharge Detection | Automatic detection 50 / 60 Hz |
| Discharge Type | Corona Discharge, Particle Discharge, Floating Discharge, Surface Discharge |
DATA STORAGE AND COMMUNICATION | |
| Storage Media | Removable 64 GB SD Card |
| Image Storage Capacity | 20,000 images |
| Annotations | Voice note: max. 60 seconds; Text note: max. 255characters |
| Video Storage Capacity | 60 hours |
| Video File Format | MP4 |
GENERAL DATA | |
| Display | 800 × 480 Resolution, 4.3’LCD Touch Screen |
| Digital Zoom | 1.0x to 16.0x continuous |
| USB Interface | USB Type-C |
| HDMI Interface | HDMI-D |
| Battery Operating Time | Approx. 3.5 hours |
| Battery Type | Dis-mountable and Rechargeable Li-ion Battery |
| Battery Charging Time | 5 hours to full charge |
| Protection level | IP54 |
| Power Supply | 5V DC/2A (Charging via USB) |
| Working Temperature Range | -20 °C to 50 °C |
| Storage Temperature Range | -20 °C to 60 °C |
| Approvals | CE, UKCA, RCM, ICES, KC |
| Relative Humidity | <90 % non-condensing |
| Weight | Approx. 940 g |
| Dimension | 292.2 × 127 × 110.7 mm (11.50 × 5.00 × 4.36 in) |

| No. | Question | Answers | Pictures | |||||
| 1 | Why can an acoustic imaging detector detect sound sources? | Acoustic imaging detector has multiple microphones which form an array detecting sound vibrations. Time difference exists when the sound signal is received at the mic array due to the mics’ different positions. Using this information, acoustic imaging detector can determine the direction and location of the sound. Using beam forming technology, it can strengthen the signal and weaken the interference between multiple collected sound waves. | ||||||
| 2 | Can the acoustic imaging detector detect corona discharges? | Yes, it can. An acoustic imaging detector can be used to detect partial discharges including but not limited to corona discharge. The camera can identify more discharge types such as particle discharge, floating discharge, and surface discharge. | ||||||
| 3 | What advantages does an acoustic imaging detector have with more microphones? | The distribution and number of microphones can affect the range and fineness of the detectable frequency. With the same microphone distribution, the more microphone in an acoustic imaging detector, the smaller the vibration (sound signal) can be detected, and the wider the effective detection range. | ||||||
| 4 | What’s the meaning of the dB value in the upper left corner and the KHz value on right side of the camera interface? | dB is the unit of sound intensity. The greater the sound intensity, the louder the sound. KHz is the unit of sound frequency. The higher the frequency, the sharper the sound. The dB value of Max displayed in the interface is the peak sound intensity within the specific yellow sound spectrum box. The longer the length of the blue stripe, the greater the sound intensity. |
|
|||||
| 5 | How can I quickly find leaks in a pipe? | The typical frequency of a gas leak is between 25 KHz and 45 KHz. A real leak should be stable as long as the air compressors normally work. For practical use, you can use any one of the three preset frequency ranges to have a quick scan on the pipe and find an acoustic palette stably at a place. You should move the camera to change its viewing angle and confirm the palette is not a reflection. Then a leak is likely there in the pipe. If verification is required, safety is the priority. You may need other tools to double confirm. | ||||||
| 6 | Why does the camera offer two range options, 65 kHz and 100 kHz? | S532 acoustic imaging detector can technically detect sound of frequency up to 96 kHz. For user experience, the upper limit showing on the sound spectrum is defined as 100 kHz. In practice, the higher the sound frequency, the much more the strength attenuation during transmission through the air. The differentiable signals among the background noises are usually less than 65 kHz. For experienced inspectors who are familiar with their inspection sites, they are likely to use several sound frequency ranges that they frequently meet during inspection works, and the zoomed range (0 – 65 kHz) would be more efficient for manually adjusting the yellow frame of detection range. | ||||||
| 7 | What if no stable acoustic palette in all preset frequency ranges, or too many palettes to find a stable one? | You can turn off Multiple Sources in the settings menu to find a single leak (the strongest leak) in a scene. Get start with the highest frequency range and widest detection spectrum (yellow box on right side of the camera interface). If no acoustic palette on the pipe during a quick scan with your camera, please lower the detection frequency (level) and repeat the scan, until an acoustic palette appears and stays somewhere on the pipe. Then narrow the yellow sound spectrum box (span) to minimize impacts from unstable sounds which are possibly noises. | ||||||
| 8 | How can I know the frequency of a gas leak (or partial discharge)? | Though acoustic imaging detectors don’t say the frequency of an acoustic palette, we can roughly know by the following steps. 1. Ensure a stable acoustic palette is in the camera interface. 2. Narrow the yellow sound spectrum box on right side of the camera interface. 3. Stop narrowing when the acoustic palette disappears and tune the yellow box back a little. Note: The target frequency is included in the spectrum range. The narrower the yellow box, the more accurate the estimated frequency. |
||||||
| 9 | How many leaks can acoustic imaging detector detect at a time? | The camera can provide many (more than 3) acoustic palettes representing possible leaks and their reflections caused by surroundings, when Multiple Sources in the settings menu is turned on. The detection algorithm ensures all presented palettes are in similar sound intensities. It’s not easy for a user to keep reflections away in a practical scenario, since a pipe is usually mounted near a wall, ceiling, or equipment that can reflect gas also forming acoustic palettes in the acoustic imaging detector. For this reason, Multiple Sources is recommended to be off for the strongest source at a moment. One acoustic palette in a snapshot can clearly tell a suspected leak. One more snapshot with another acoustic palette on a different place tells another suspected leak. In this way, it is no longer a goal to find multiple real leaks against reflections and noises. The goal is to source the strongest, secondary, and weaker leaks in a scene with multiple snapshots. You can just change your position and angle your camera to physically avoid the found stronger leaks. |
||||||
| 10 | What’s the effect of Sensitivity settings in acoustic imaging detector? | 3 out of 5 is the default. The larger the number is, the more sensitive the acoustic pattern behaves. In a mid- or long-range scenario such as partial discharge detection, the sound source could be in 10 m away or even further. A high Sensitivity is helpful for displaying a weak signal as a palette in the camera screen. For a near-range scenario, sound is usually strong enough. The Sensitivity should be low. In practice, Sensitivity should be manually adjusted case by case. Please note that the more sensitive is, the more noise would be collected. | ||||||
| 11 | What’s the effect of Distance settings in acoustic imaging detector? | Distance works for compensation against attenuation when sound goes through the air before arriving at the microphone array in the acoustic imaging detector. Leak cost, leak rate, leak level, and discharge level are dependent on the compensation. Inspectors can roughly set a distance at the first scan, but it should be as accurate as possible after a stable acoustic palette shows in the camera screen for correct lost estimations. | ||||||
| 12 | Can the acoustic imaging detector detect corona discharges? | Yes, it can. An acoustic imaging detector can be used to detect partial discharges including but not limited to corona discharge. The camera can identify more discharge types such as particle discharge, floating discharge, and surface discharge. It may tell noise if discharges are too weak or don’t exist. | ||||||
| 13 | How does the PRPD diagram generate? | An electrical system usually works in Alternative Current (AC) conditions, 50 times or 60 times (in different countries) in one second. Every time the applied voltage on a defect of an object would be up and down as time goes by, leading the defect discharges at a specific time and amplitude. The discharges form into a shape at a period and repeat 50 or 60 times in one second. The overlapped shape is the PRPD diagram in the acoustic imaging detector. | ||||||
| 14 | Is there a minimum requirement for PRPD on detectable frequency range or quantity of microphones? | S532 acoustic imaging detectors can provide PRPD diagram and PD type identification such as corona discharge. Theoretically, the more the microphones and the higher the detectable frequency range, the more accurate the PRPD and PD type identification. | ||||||
| 15 | What tips do you have for demonstrations? | Tip1: Avoid reflections. Try to find an open place, avoiding walls, doors, desktops. Tip2: Avoid environmental noises. Some machines (such as lawn mower, hand dryer) overwelmingly create noises. Inspectors should try to avoid these occasional factors during practical use. Tip3: As strong as possible. Though weak leaks can be detected, but stronger noises from the background can appear and distract. The camera would display acoustic palettes on random noises instead of the designated sound generator. Please prepare a mobile App in advance in case the demo leaks or discharges are not strong or stable enough. Freqency Generator is a free mobile App in App stores. |
||||||
| 16 | What does High mean in detection of a corona discharge? | The displayed strength indicates the discharge strength at the location of discharge. High: >18 dB. Medium: 12 dB to 18 dB Low: 8 dB to 12 dB Normal: < 8 dB |
||||||
| 17 | What are Intensity Range and Intensity Delta? | Intensity Range is Auto by default, which takes the advantage of the detection algorithm to present the acoustic pattern of a proper size. The larger the pattern size, the more probable the pattern covers the strongest sound source. Intensity Delta is a parameter that users can specify after selecting the Auto and changing it to Manual. | ||||||
| 18 | What is Level in Acoustic Settings? | An acoustic pattern is overlaid on the visual image and can block the interested target if the pattern is not transparent. For this reason, transparency should be available in various levels for different user preferences. The pattern would disappear when Level is 0, and 100% Level for complete blocking. | ||||||
| 19 | Can S532 support optical zoom? | Can not. S532 supports digital zoom only. | ||||||
| 20 | Do you have S532 calibration certificate? | No, because this is not a measuring instruments it’s an imaging detector, therefor no calibration required, just the standard production and out going test procedures. | ||||||
| 21 | How to detect multiple leaks? | Please open the Multiple Source Setting. And switch the intensity range from Auto (default) to Manual, and set the related Intensity Delta ( …10DB) number, which means the DB difference between the bigger one and the smaller one. |
|
|||||
| 22 | How to set the frequency in the beginning? | Step 1: Set the frequency range Settings > Acoustic Settings > Frequency > Select 0~65 kHz Step 2: Set the frequency range to 2 from home screen, because typical frequency of a gas leak is within 25~45 KHz. Of course, customer can set the frequency range to their actual needs. There are 3 types of ranges as below: 1. 20-50 kHz 2. 25-45 kHz 3. 45-65 kHz |
|
Personal advice
Would you like to receive more information about products and applications?
Or do you need personal advice? We’re here to help!